The physical analysis of materials through a digitalized image has been evolving in different areas. The technology enables us to recognize, with precision and speed, physical aspects for different purposes. In the specific case of rice samples, since a very long time these analyses have traditionallybeen done handmade through the visual recognition of the grains, as for example: chalk area, white center, pecked grains, yellow grains, variety mix, etc. It is common ground that the visual recognition is subjective and presents variation in the results over a same sample when analyzed more than once. It shows us that some aspects, as a slightly out of pattern coloration (yellow grains) and the amount of chalk area in the grain (white belly), make it extremely difficult to visually set a standard.
The dimensional analysis, when not digital, is made with the use of some tools, as: trieur machines, sieves and calipers. In order to get more precise results when measuring the size of the grains, it is necessary to use the calipers to measure the grains that are on the edge of framing, for example among the ones considered whole and broken. The problem is that using the calipers takes a long time, depending on the amount of broken grains in the sample. One way of buying some time is by using just the trieur machine with acceptance for small variations.
It is known that both the amount and frequency of handmade analyses is way below the rice milling industry necessity due to the time spent. For example, analyzing waste products, as residue and different types of broken grains, is very difficult through a handmade method.However, an analysis is highly necessary when it comes to get the maximum exploitation from the raw material flux. Both the high volume of rice which is processed in the milling line and the variation of grains in the raw material flux, justify this care and the necessity of increasing the frequency of the analyses since the arrival of the raw material to the milling of the end product. “In the rice business, you profit over the details” as stated by people from the area.
An important aspect about the handmade analysis of the grain coloration is that it will always be attached to the human sight. The visual criteria of whom analyzes depends on suitable capacitation and criteria unification.
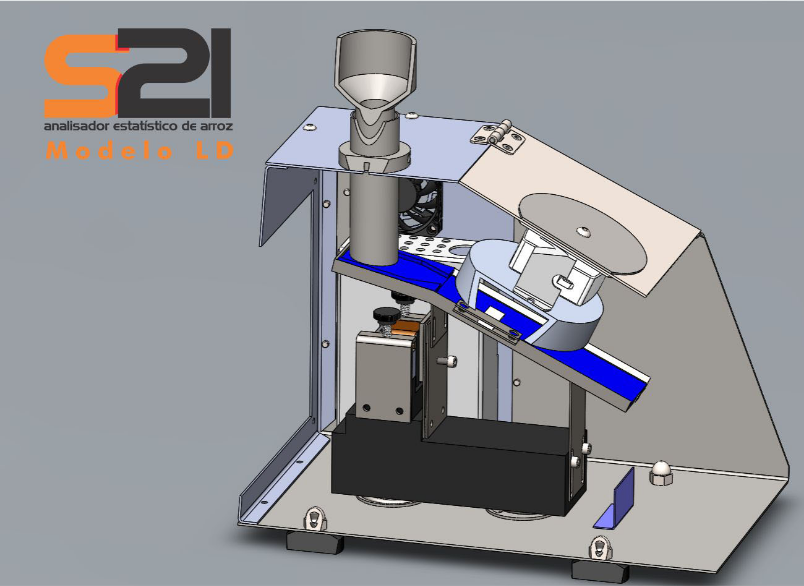
By the advent of rice analysis through digital image pioneering developed by the S21 system, we have a huge change in the analyses routine, not only in aspects as speed and larger frequency, but also when it comes to a “break” in the human eye subjectivism in reckoning aspects of the rice grain.
When developing the S21 system, it was sought by a combination of hardware and software, to fill in a gap that existed inside the analyses and quality control labs, a simulation of the electronic selector by colorof the industry, and therefore obtain (or predict) through the S21, the industrial yield index from a raw material flux with more precision and speed.
The S21 comes to replace the sample trieur to dimensionally set apart whole from broken grains, with additional details such as average length and widthof whole grains, percentage of clipped whole grains, 3/4, 1\2, 1\4, perfect whole, canjicão, canjica and rice grits. It is possible to create a complete histogram by length strips and also by chalk area strips presented in the grain.
The analyses take from 90 seconds to 3 minutes. All the selected percentages present on the computer screen the image of the grains that originated the given result. The quality of the S21 system can be assessed by the repeatability in the results, with low statistic deviation. It is possible to create countless types of personalized reports.
The S21 tool, has brought an important advancement to the rice industry, we dare to say that it became indispensable, due to its precision, nature and speed. It has brought in its core an innovative view of quality control to the rice sector. Who could ever wonder that through the S21 it would be possible to know the total chalk area present in a sample? That is, the S21 gives us the total chalk area sum of a sample in just one index. The more vitreous the sample, smaller its total chalk area. How about a histogram to identify how the chalk area is distributed through the grains of the sample? Is it concentrated in the form of chalked grains or white belly? What is the difference? How does it affect the industrial yield? These are the new aspects, among others, raised by the digital analyses system S21.
The aims of the physical analyses in rice samples are:
1. Predicting and recognizing its industrial value in the entrance (purchase and selling) of raw material.
2. Ostensibly control of the rice flux and equipment calibration at the production line.
3. Concomitantly fulfil the norms that set the consume standards.
We will soon talk deeper about the use of the S21 in each of the topics above, its great advantages, some limits and solutions. Keep in touch.